Slide 1
Good morning Mr. Chairman and Commissioners, the Office of Electric Reliability and the Office of Energy Policy and Innovation present their 2020/2021 Winter Energy Market Assessment. The Winter Energy Market Assessment is staff’s opportunity to look ahead to the coming winter and share its thoughts and expectations about market preparedness.
Slide 2
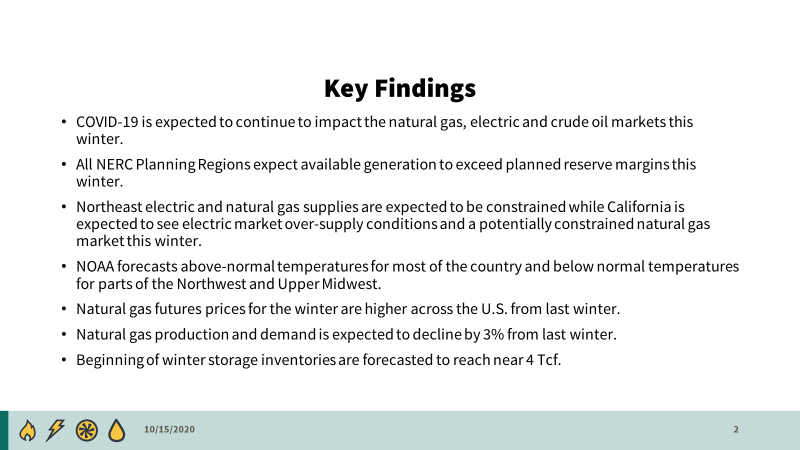
Across the U.S. this winter, the COVID-19 pandemic is expected to continue to impact the natural gas, electric and crude oil markets. All NERC Planning Regions expect to have enough generation available to meet their planned reserve margins through the winter. Finally, in the Northeast, electric and natural gas supplies are expected to be constrained, while California is expected to see over-supply conditions in the electric market and a potentially constrained natural gas market this winter.
Trends in natural gas and electric fundamentals heading into the winter are driven – as in all years – by weather and – unique to this year – by the impact of COVID-19. As to weather, the National Oceanic and Atmospheric Administration (NOAA) forecasts a mild winter for most of the country, with a greater probability of above normal temperatures for most of the continental U.S, a greater probability of below normal temperatures in the upper Northwest and an equal chance of above or below normal temperatures for the Upper Midwest, the Rockies and a portion of the Northwest. Although gas-fired capacity continues to grow in most markets, the share of U.S. electric generation fueled by natural gas in the winter is expected to decrease from 38 percent in 2019/2020 to 34 percent in 2020/2021 owing to increased competitiveness of coal resources from expected higher natural gas prices this winter. Natural gas futures prices for the winter are higher at major trading hubs across the U.S. compared to the final settled futures prices of Winter 2019/2020. Largely due to COVID-19 impacts and an expected warm winter, demand for natural gas this winter is forecasted to decrease by 3 percent from last winter. Finally, natural gas storage inventories are expected to begin the winter withdrawal season at 3.95 Trillion cubic feet (Tcf), the third highest inventory level in the past 10 years. As a result, storage inventories should be sufficient to meet demand this winter.
Slide 3
In early spring, some utilities chose to delay maintenance outages until the fall season to address the newly evolving COVID-19 concerns and provide additional time for planning. Many of these delayed tasks have since been completed during a compressed fall maintenance season.
Utilities have also adopted procedures to meet COVID-19 related safety requirements and recommendations based on Center for Disease Control guidance including providing Personal Protective Equipment, implementing social distancing strategies and adjusted shifts to separate local and traveling teams during event response to protect utility employees and customers.
This has allowed work towards adequate winterization and seasonal preparations of Bulk Power System facilities including fuel reliability risk analysis which are essential to ensuring the availability of essential generation, transmission and fuel infrastructure during weather events such as storms, wildfires or extreme cold. To best accomplish this, utilities can apply recommendations such as those outlined in the 2019 FERC and NERC Staff Report on the January 17, 2018 Cold Weather Bulk Electric System Event, and the Reliability Guidelines on Fuel Assurance and Fuel Related Reliability Risk Analysis and Generating Unit Winter Weather Readiness.
Slide 4
Data from the NERC Regional Entities and ISOs/RTOs indicate that planning reserve margins for all regions are projected to be adequate this winter. The blue columns shown in Figure 2 display the anticipated reserve margins for the markets and regions, while the black bars indicate the reference reserve margins. The lowest reserve margins are expected in SERC-E, representing North and South Carolina, though its expected reserves of 22 percent are still expected to exceed NERC’s reference margin level of 15 percent.
Although all regions are expected to maintain adequate reserve margins through the winter, reserve margins are not always guarantors of reliable operations during the winter. Fuel availability, particularly natural gas and fuel oil, can affect generator availability and must be monitored by ISO/RTO staff to ensure reliability of supply. Also, transmission operators must accurately forecast solar and wind generation and take forecasted generation into account when managing the intra-day and intra-hour transition periods of high renewable resource availability to periods of lower renewable resource availability to ensure reliable operating conditions.
Slide 5
During the winter months, prices in the Northeast electricity markets are strongly correlated with natural gas prices. Due to the high winter demand and limited pipeline capacity, winter natural gas prices often peak during the coldest days of the year.
ISO-NE’s power generation fleet is predominantly fueled by pipeline-sourced natural gas, which is also heavily used for home heating in New England. When natural gas demand from power plants is displaced by firm obligations to serve natural gas local distribution companies, oil-fired plants, which are typically not economic in most hours, are activated to supply power. When this occurs for extended periods, oil-fired plants run the risk of exhausting their fuel supplies or exceeding environmental limitations, which can create reliability concerns.
For the past two winters, ISO-NE has implemented its new Energy Market Opportunity Cost project. This project enhances the ability of economic commitment and dispatch under stressed operating conditions by estimating an opportunity cost for oil-fired and dual-fuel generators and incorporating the cost into reference prices. Although it was not used in the past two winters due to mild weather, the Energy Market Opportunity Cost allows critical oil-fired generation to be held for the moments of highest need.
In California, electric markets are expected to be in a relatively good position heading into the winter in terms of installed capacity, although CAISO may experience over-supply conditions due to lower load and increased renewable production. Specifically, CAISO’s winter peak load is usually 35 GW, which is about 10 GW less than the summer peak load. Further, in late winter, CAISO typically generates a growing supply from hydro, wind and solar generation relative to demand. When there are lower demand levels and exports cannot absorb the growing supply, CAISO curtails renewable generation. For example, in January and February 2020, CAISO curtailed about 138 GWh of energy (9% of solar generation) and 157 GWh of energy (8% of solar generation) respectively, whereas it only curtailed about 31 GWh of energy in July 2020.
In the natural gas market, outages on pipelines within California that required CAISO to limit natural gas use by power plants over the last two winters have been resolved. The restoration of the pipelines will increase access to gas supply this winter. However, unplanned maintenance outages could occur this winter as they did in previous winters, and these pipelines, at times, may operate at less than full capacity during unplanned maintenance events. In addition, Aliso Canyon, the region’s largest storage field, is still operating at a reduced capacity limiting withdrawals from the facility. Finally, reduced supply from the Rockies and the Permian is expected as rig counts in both regions have fallen due to lower crude oil prices and economic impacts from the ongoing pandemic.
Slide 6
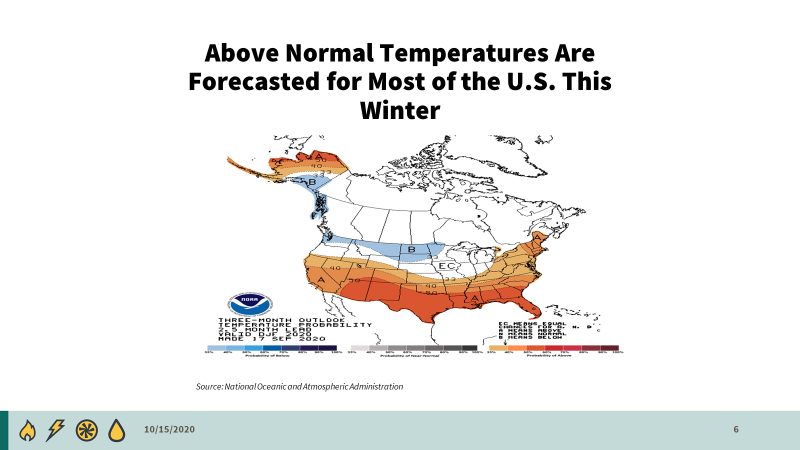
Slide 6 depicts the relative probabilities for above or below normal temperatures for regions across the U.S. this upcoming winter. NOAA forecasts this winter will be mild for most of the country. For December 2020, January 2021, and February 2021, NOAA assesses a 50 percent probability of above normal temperatures throughout the Gulf Coast, the Southwest, and most of the southeastern United States. Similarly, most of California, the lower Midcontinent and upper southeastern U.S. and New England was assessed a 40 percent probability of above normal temperatures and the Northeast and Mid-Atlantic regions were assessed a 33 percent probability of above normal temperatures. The upper Northwest and portions of the upper Midwest were assessed a 33% probability for below normal temperatures. Finally, the majority of the upper Midwest, the Rockies, and most of the Northwest have an equal chance of above normal, below normal or normal temperatures this winter.
Slide 7
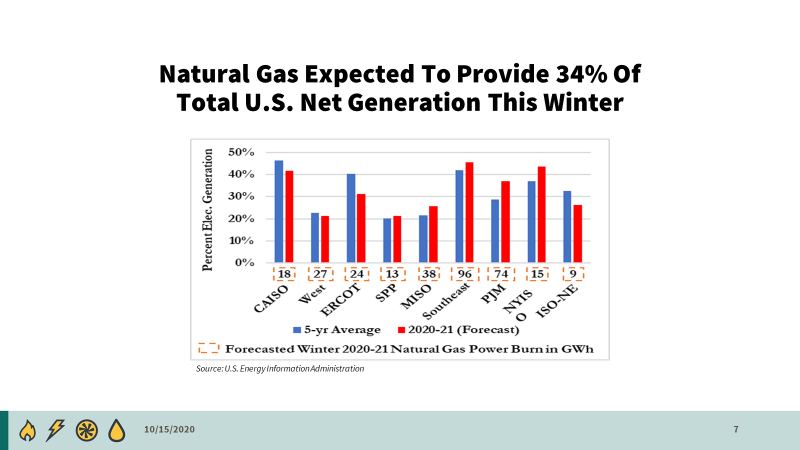
The share of U.S. electric generation provided by natural gas in the winter is expected to decrease from 38 percent in 2019/2020 to 34 percent in 2020/2021. In the past five years, natural gas’ share of generation has ranged between 27-38 percent of total U.S. generation in the winter. Regionally, the largest forecasted increases in natural gas generation are in NYISO and PJM, while CAISO, ERCOT, New England, and the U.S. West are forecasted to see small-to-medium declines in natural gas’ expected share of generation compared to the five-year average. CAISO, NYISO, PJM, the Southeast, and ERCOT are the most dependent regions on natural gas, each deriving more than 30 percent of its electricity from the fuel. ISO-NE, which generally receives more than half of its summer generation from natural gas, moves to other generation sources in winter as residential and commercial heating demand for natural gas increases.
Slide 8
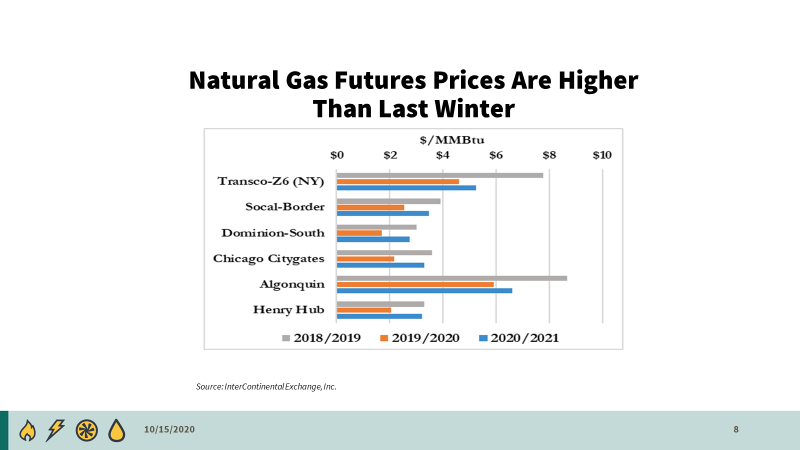
Natural gas futures prices for Winter 2020/2021 are higher at major trading hubs across the U.S. compared to the final settled futures prices of Winter 2019/2020, primarily due to the uncertainty of COVID-19 and its effects on energy markets. Overall, the lower expected demand and declining production levels resulting from COVID-19 are putting mixed pressure on natural gas prices for the winter, but forecasting is more difficult than usual because of the larger economic uncertainty. As of September 21, 2020, the Henry Hub average futures contract for December, January, and February was 57 percent higher than the Winter 2019/2020 average settled price. Regional natural gas prices are calculated by adding the Henry Hub winter futures price to the winter basis futures prices at major trading hubs in the United States. The Chicago Citygate hub is currently seeing winter futures prices that are 52 percent higher than settled prices in Winter 2019/2020 and Transco Z6 (NY), a major hub outside New York City, is up 14 percent. Winter futures prices at the SoCal-Border hub near Los Angeles have risen 37 percent despite high natural gas storage inventories and improving import capacity, as there is reduced upstream supply from the Rockies and Permian Basin. Winter futures prices at Algonquin Citygate, outside Boston, follow the trend at major trading hubs, rising 12 percent. At supply hubs, winter futures prices increased at the Permian Basin’s Waha trading hub by 191 percent over Winter 2019/2020, rising above the Appalachian hub Dominion-South which is up 61 percent.
Slide 9
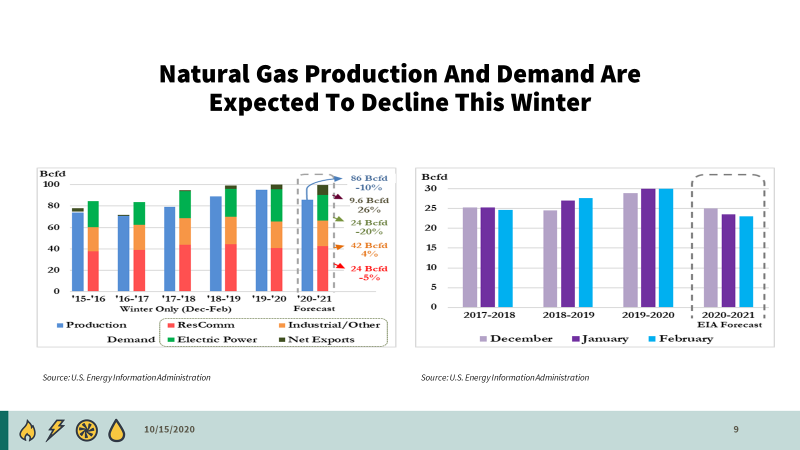
As of September 2020, demand for natural gas in Winter 2020/2021 is forecasted to decrease by 3 percent from Winter 2019/2020 to 100 Bcfd. This contrasts with the winter demand growth reported in 2018/2019 and 2019/2020 of 5 percent and 4 percent, respectively. This winter, year-over-year demand growth is only forecasted for the residential and commercial sectors. Natural gas consumption by the electric power sector for the generation of electricity, known as power burn, is forecasted to average 24 Bcfd, down 20 percent from Winter 2019/2020, after averaging 5 percent growth annually since Winter 2015/2016. The forecasted decrease in power burn compared to last winter is largely the result of lower forecasted electricity production due to milder weather and effects from the COVID-19 related load decreases. The EIA estimates that overall U.S. electrical generation will be 2.6% lower than the same period last year.
Natural gas production in the United States is expected to decline winter-over-winter for the first time in four years, and is forecasted to average 86 Bcfd during Winter 2020/2021, a decrease of 10 percent compared to the previous year. Winter production had grown by at least 7 percent in each of the prior three years. The COVID-19 pandemic put downward pressure on Summer 2020 natural gas production due to lower expected demand for natural gas. Recent low crude oil prices also depressed expectations of crude oil-associated natural gas production. With crude oil prices remaining near break-even prices in wet shale basins, associated natural gas production could stay low relative to prior years.
Slide 10
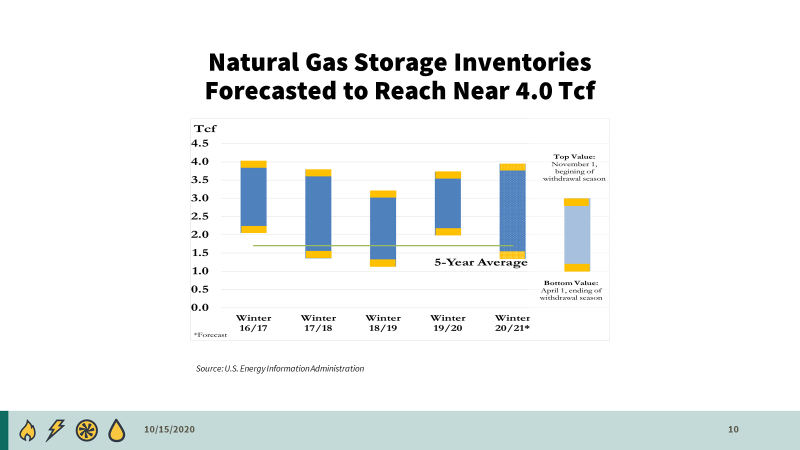
Natural gas storage inventories are forecasted to begin the winter withdrawal season at the third highest inventory level in the past 10 years at 3.95 Tcf and end the withdrawal season at 1.34 Tcf, the third lowest level in the past 10 years. The current natural gas storage inventory is a result of a relatively normal injection season, which runs from April 1, 2020, to October 31, 2020. Although low natural gas prices incentivized power burn this spring and summer, storage is forecasted to reach nearly 4 Tcf by November 1. Storage inventories began the 2020 injection season at 2.02 Tcf, 75 percent higher than the start of the 2019 injection season and 19 percent higher than the five-year average for the first week of April. The ending injection season storage level is forecasted to reach 3.95 Tcf. The 1.93 Tcf injected this spring and summer would be the fifth lowest injection level in the past 10 years.
Slide 11
This concludes staff’s prepared comments. A copy of this presentation and a full report will be posted on the Commission’s website. We are available to answer any questions you may have.
This page was last updated on October 15, 2020


